Zoom Notes 07: Combining Data
Semester 2, 2023
Associated Material
Module: Module 07 - Combining data
Readings
Combining Data
How to combine datasets together
- rows
- columns
- using data relationships
Binding
- Combining rows of datasets with same column names together with
rbind - Combining columns of datasets together with
cbind- caution on using
cbindand maintaining data integrity - use joins if possible
- caution on using
Joining
Adding additional columns onto data sets by using a common identifier (key) between datasets to maintain data relationships
Inner join
inner_joinfromdplyrwill join datasets on a key and at the same time filter so that only rows where there is a matching key will be kept
Left/Right joins
left_joinandright_joinfromdplyrwill join datasets on a key and keep all rows from the specified ‘side’ of the join, and filling in the non-matching entries withNA
Full joins
full_joinfromdplyrwill join datasets on a key and keep all rows from both datasets filling in columns of non-matching entries withNA
Excercises
- Using
flightsandplanesfrom thenycflights13package, how many flights were flown in April 2013 by aircraft with each engine type? e.g. Turbo-fan, Turbo-jet, etc.
- How many
flightsfor the carrierAAwith a destination (dest) ofIAH, and carrierDLwith a destination ofATLwere late? and how many early?- First create a dataframe with two columns:
carrieranddest, and fill in the specific data. - Use inner-join with your dataframe and
flights, specifyingby = c("carrier", "dest")to result in a dataframe with rows matching the conditions, assign intoflights_of_interest. - Now take
flights_of_interestand create two new datasets, one for the late arrivals (late) and the second for early arrivals (early). How many rows in each?
- First create a dataframe with two columns:
- Using the datasets (
earlyandlate) you created in 2, create:- a box plot for each of
earlyandlateusingarr_delaybycarrier - add a extra column
statusonto each dataset with the values “early” forearlyand “late” forlate - combine the datasets and create a box plot of status versus
air_time, but also make it a facet plot using
month, with 6 columns and 2 rows (hint look upfacet_wrap). Are there any trends you notice?
- a box plot for each of
Example solutions
library(tidyverse)
library(nycflights13)

flights %>%
  filter(month == 3 & year == 2013 & !is.na(arr_time)) %>%
  inner_join(planes, by = "tailnum") %>%
  group_by(engine) %>%
  summarise(n_flights = n())
#> # A tibble: 6 × 2
#>   engine        n_flights
#>   <chr>             <int>
#> 1 4 Cycle               3
#> 2 Reciprocating       165
#> 3 Turbo-fan         20114
#> 4 Turbo-jet          3391
#> 5 Turbo-prop            9
#> 6 Turbo-shaft          48
carrier_dest <- data.frame(carrier = c("AA", "DL"), dest = c("IAH", "ATL"))
flights_of_interest <- inner_join(flights, carrier_dest, by = c("carrier","dest"))
late <- flights_of_interest %>% filter(arr_delay > 0)
early <- flights_of_interest %>% filter(arr_delay < 0)
nrow(late)
#> [1] 4419
nrow(early)
#> [1] 6088ggplot(early, aes(x = carrier, y = arr_delay)) + geom_boxplot()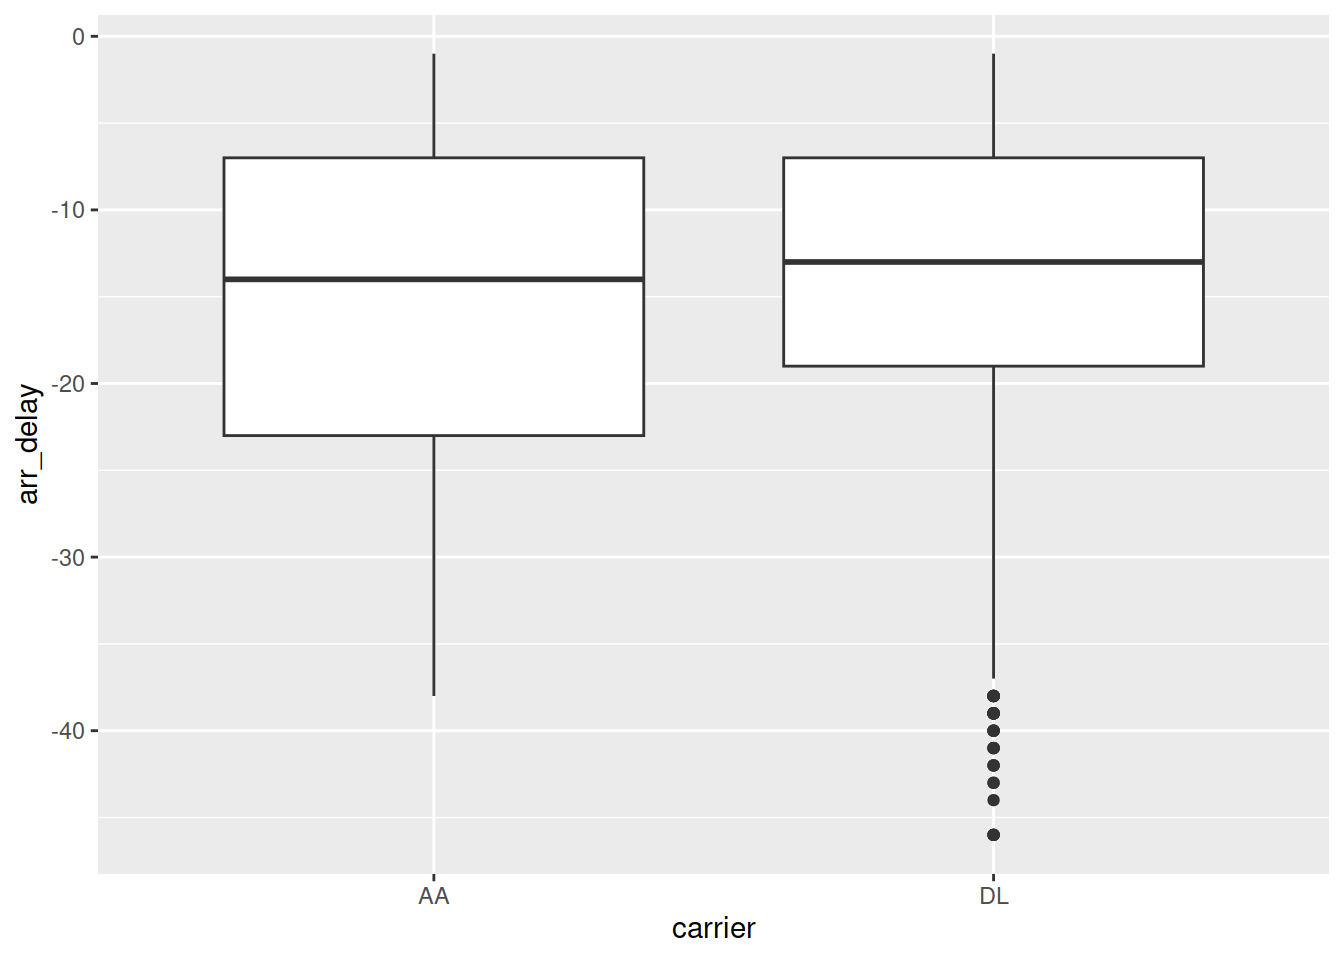
ggplot(late, aes(x = carrier, y = arr_delay)) + geom_boxplot()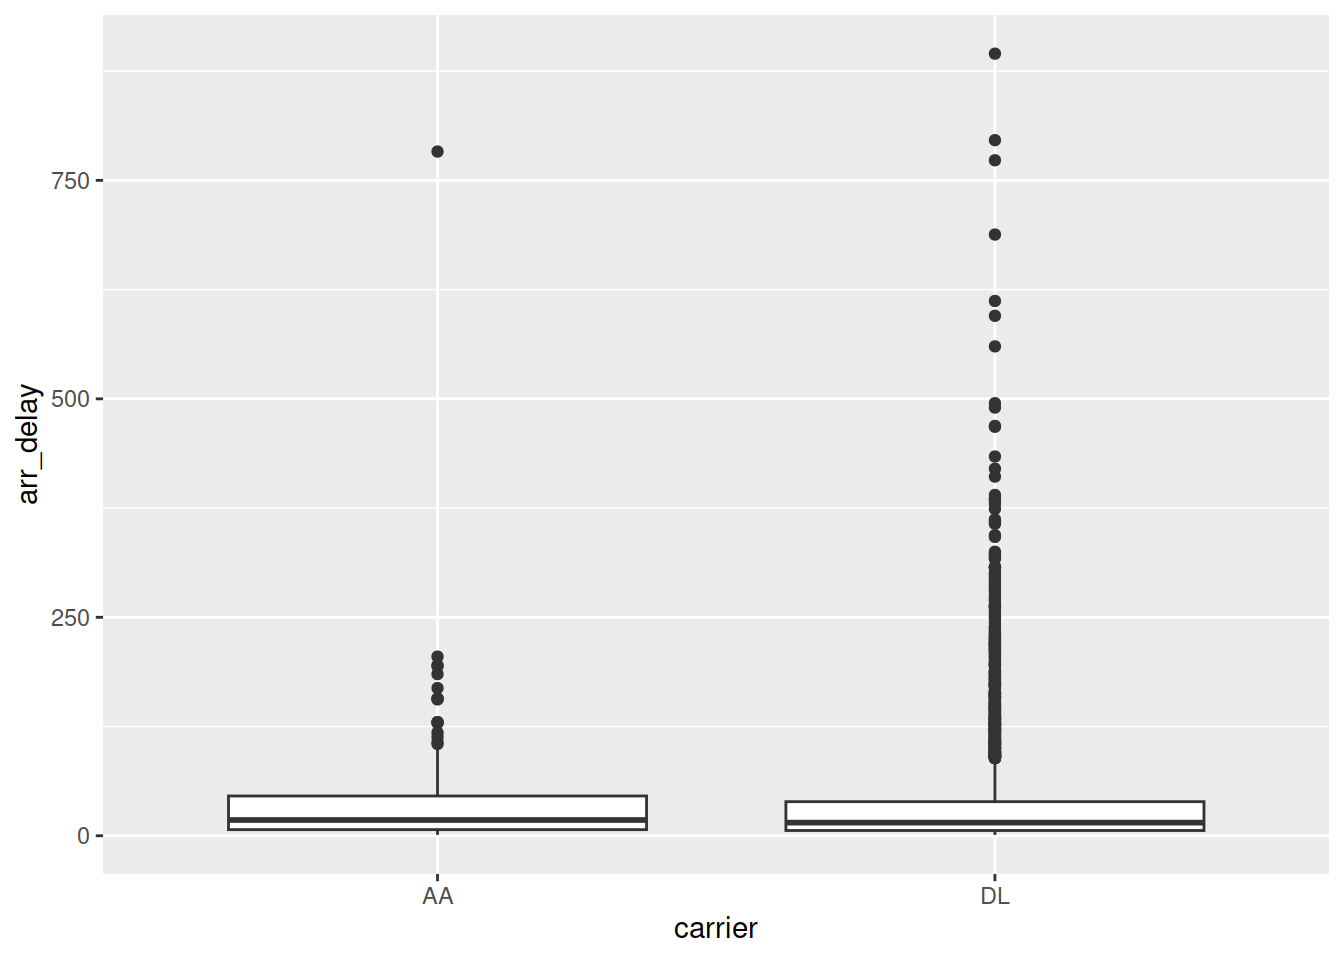
early <- early %>% mutate(status = "early")
late <- late %>% mutate(status = "late")

rbind(early,late) %>%
  ggplot(aes(x = status, y = air_time)) +
  geom_boxplot() +
  facet_wrap(vars(month), nrow = 2, ncol = 6,)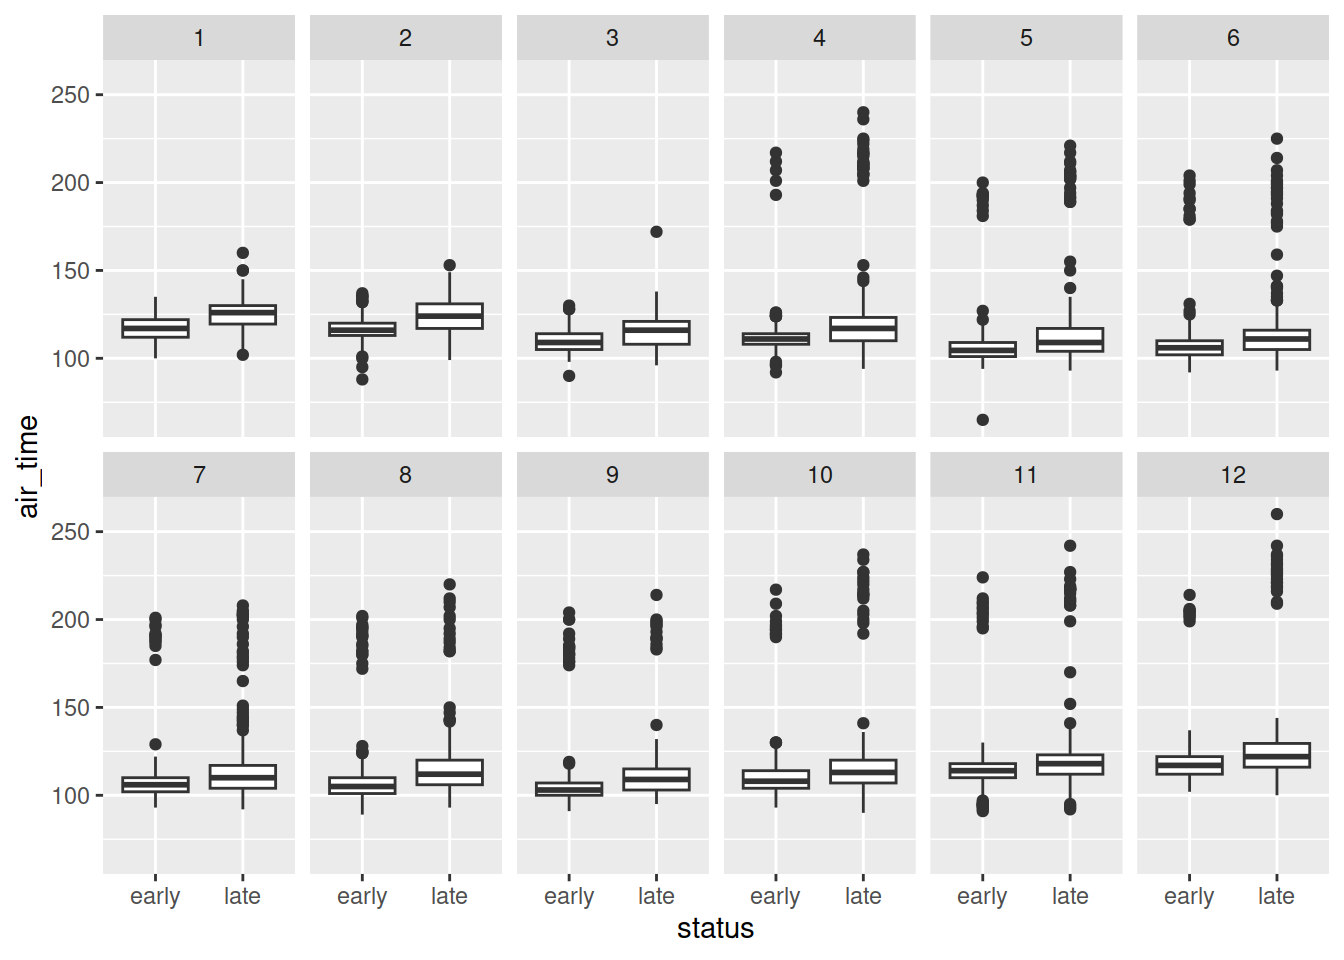
LS0tCnRpdGxlOiAiWm9vbSBOb3RlcyAwNzogQ29tYmluaW5nIERhdGEiCmRhdGU6ICJTZW1lc3RlciAyLCAyMDIzIgpvdXRwdXQ6CiAgaHRtbF9kb2N1bWVudDoKICAgIHRvYzogdHJ1ZQogICAgdG9jX2Zsb2F0OiB0cnVlCiAgICB0b2NfZGVwdGg6IDMKICAgIGNvZGVfZG93bmxvYWQ6IHRydWUKICAgIGNvZGVfZm9sZGluZzogc2hvdwotLS0KCj4gIyMjIyBBc3NvY2lhdGVkIE1hdGVyaWFsCj4KPiBNb2R1bGU6IFtNb2R1bGUgMDcgLSBDb21iaW5pbmcgZGF0YV0oMDctY29tYmluZS5odG1sKQo+Cj4gUmVhZGluZ3MKPgo+IC0gW1IgZm9yIERhdGEgU2NpZW5jZSBDaGFwdGVyIDEzXShodHRwczovL3I0ZHMuaGFkLmNvLm56L3JlbGF0aW9uYWwtZGF0YS5odG1sKQoKCmBgYHtyIHNldHVwLCBpbmNsdWRlPUZBTFNFfQpsaWJyYXJ5KGtuaXRyKQpsaWJyYXJ5KHRpZHl2ZXJzZSkKCmtuaXRyOjpvcHRzX2NodW5rJHNldCgKICBjb21tZW50ID0gIiM+IiwKICBmaWcucGF0aCA9ICJmaWd1cmVzLzA3LyIsICMgdXNlIG9ubHkgZm9yIHNpbmdsZSBSbWQgZmlsZXMKICBjb2xsYXBzZSA9IFRSVUUsCiAgZWNobyA9IFRSVUUKKQoKCmBgYAoKCiMjIENvbWJpbmluZyBEYXRhCgpIb3cgdG8gY29tYmluZSBkYXRhc2V0cyB0b2dldGhlcgoKLSByb3dzCi0gY29sdW1ucwotIHVzaW5nIGRhdGEgcmVsYXRpb25zaGlwcwoKIyMjIEJpbmRpbmcKCi0gQ29tYmluaW5nIHJvd3Mgb2YgZGF0YXNldHMgd2l0aCBzYW1lIGNvbHVtbiBuYW1lcyB0b2dldGhlciB3aXRoIGByYmluZGAKLSBDb21iaW5pbmcgY29sdW1ucyBvZiBkYXRhc2V0cyB0b2dldGhlciB3aXRoIGBjYmluZGAKICAtIGNhdXRpb24gb24gdXNpbmcgYGNiaW5kYCBhbmQgbWFpbnRhaW5pbmcgZGF0YSBpbnRlZ3JpdHkKICAtIHVzZSBqb2lucyBpZiBwb3NzaWJsZQoKIyMjIEpvaW5pbmcKCkFkZGluZyBhZGRpdGlvbmFsIGNvbHVtbnMgb250byBkYXRhIHNldHMgYnkgdXNpbmcgYSBjb21tb24gaWRlbnRpZmllciAoa2V5KSBiZXR3ZWVuIGRhdGFzZXRzIHRvIG1haW50YWluIGRhdGEgcmVsYXRpb25zaGlwcwoKIyMjIyBJbm5lciBqb2luCgotIGBpbm5lcl9qb2luYCBmcm9tIGBkcGx5cmAgd2lsbCBqb2luIGRhdGFzZXRzIG9uIGEga2V5IGFuZCBhdCB0aGUgc2FtZSB0aW1lIGZpbHRlciBzbyB0aGF0IG9ubHkgcm93cyB3aGVyZSB0aGVyZSBpcyBhIG1hdGNoaW5nIGtleSB3aWxsIGJlIGtlcHQKCiMjIyMgTGVmdC9SaWdodCBqb2lucwoKLSBgbGVmdF9qb2luYCBhbmQgYHJpZ2h0X2pvaW5gIGZyb20gYGRwbHlyYCB3aWxsIGpvaW4gZGF0YXNldHMgb24gYSBrZXkgYW5kIGtlZXAgYWxsIHJvd3MgZnJvbSB0aGUgc3BlY2lmaWVkICdzaWRlJyBvZiB0aGUgam9pbiwgYW5kIGZpbGxpbmcgaW4gdGhlIG5vbi1tYXRjaGluZyBlbnRyaWVzIHdpdGggYE5BYAoKIyMjIyBGdWxsIGpvaW5zCgotIGBmdWxsX2pvaW5gIGZyb20gYGRwbHlyYCB3aWxsIGpvaW4gZGF0YXNldHMgb24gYSBrZXkgYW5kIGtlZXAgYWxsIHJvd3MgZnJvbSBib3RoIGRhdGFzZXRzIGZpbGxpbmcgaW4gY29sdW1ucyBvZiBub24tbWF0Y2hpbmcgZW50cmllcyB3aXRoIGBOQWAKClwKCiMjIEV4Y2VyY2lzZXMKCgoKMS4gVXNpbmcgYGZsaWdodHNgIGFuZCBgcGxhbmVzYCBmcm9tIHRoZSBgbnljZmxpZ2h0czEzYCBwYWNrYWdlLCBob3cgbWFueSBmbGlnaHRzIHdlcmUgZmxvd24gaW4gQXByaWwgMjAxMyBieSBhaXJjcmFmdCB3aXRoIGVhY2ggZW5naW5lIHR5cGU/IGUuZy4gVHVyYm8tZmFuLCBUdXJiby1qZXQsIGV0Yy4KClwKCjIuIEhvdyBtYW55IGBmbGlnaHRzYCBmb3IgdGhlIGNhcnJpZXIgYEFBYCB3aXRoIGEgZGVzdGluYXRpb24gKGBkZXN0YCkgb2YgYElBSGAsIGFuZCBjYXJyaWVyIGBETGAgd2l0aCBhIGRlc3RpbmF0aW9uIG9mIGBBVExgIHdlcmUgbGF0ZT8gYW5kIGhvdyBtYW55IGVhcmx5PwogICAgYS4gRmlyc3QgY3JlYXRlIGEgZGF0YWZyYW1lIHdpdGggdHdvIGNvbHVtbnM6IGBjYXJyaWVyYCBhbmQgYGRlc3RgLCBhbmQgZmlsbCBpbiB0aGUgc3BlY2lmaWMgZGF0YS4KICAgIGIuIFVzZSBpbm5lci1qb2luIHdpdGggeW91ciBkYXRhZnJhbWUgYW5kIGBmbGlnaHRzYCwgc3BlY2lmeWluZyBgYnkgPSBjKCJjYXJyaWVyIiwgImRlc3QiKWAgdG8gcmVzdWx0IGluIGEgZGF0YWZyYW1lIHdpdGggcm93cyBtYXRjaGluZyB0aGUgY29uZGl0aW9ucywgYXNzaWduIGludG8gYGZsaWdodHNfb2ZfaW50ZXJlc3RgLgogICAgYy4gTm93IHRha2UgYGZsaWdodHNfb2ZfaW50ZXJlc3RgIGFuZCBjcmVhdGUgdHdvIG5ldyBkYXRhc2V0cywgb25lIGZvciB0aGUgbGF0ZSBhcnJpdmFscyAoYGxhdGVgKSBhbmQgdGhlIHNlY29uZCBmb3IgZWFybHkgYXJyaXZhbHMgKGBlYXJseWApLiBIb3cgbWFueSByb3dzIGluIGVhY2g/IAoKXAoKMy4gVXNpbmcgdGhlIGRhdGFzZXRzIChgZWFybHlgIGFuZCBgbGF0ZWApIHlvdSBjcmVhdGVkIGluIDIsIGNyZWF0ZToKICAgIGEuIGEgYm94IHBsb3QgZm9yIGVhY2ggb2YgYGVhcmx5YCBhbmQgYGxhdGVgIHVzaW5nIGBhcnJfZGVsYXlgIGJ5IGBjYXJyaWVyYAogICAgYi4gYWRkIGEgZXh0cmEgY29sdW1uIGBzdGF0dXNgIG9udG8gZWFjaCBkYXRhc2V0IHdpdGggdGhlIHZhbHVlcyAiZWFybHkiIGZvciBgZWFybHlgIGFuZCAibGF0ZSIgZm9yIGBsYXRlYAogICAgYy4gY29tYmluZSB0aGUgZGF0YXNldHMgYW5kIGNyZWF0ZSBhIGJveCBwbG90IG9mIHN0YXR1cyB2ZXJzdXMgYWlyX3RpbWUsIGJ1dCBhbHNvIG1ha2UgaXQgYSBmYWNldCBwbG90IHVzaW5nIGBtb250aGAsIHdpdGggNiBjb2x1bW5zIGFuZCAyIHJvd3MgKGhpbnQgbG9vayB1cCBgZmFjZXRfd3JhcGApLiBBcmUgdGhlcmUgYW55IHRyZW5kcyB5b3Ugbm90aWNlPwogICAgCgojIyMgRXhhbXBsZSBzb2x1dGlvbnMKICAgIAoxLgoKYGBge3Igem4wNy1zb2xuMSwgY2xhc3Muc291cmNlID0gImZvbGQtaGlkZSJ9CmxpYnJhcnkodGlkeXZlcnNlKQpsaWJyYXJ5KG55Y2ZsaWdodHMxMykKCmZsaWdodHMgJT4lIAogIGZpbHRlcihtb250aCA9PSAzICYgeWVhciA9PSAyMDEzICYgIWlzLm5hKGFycl90aW1lKSkgJT4lCiAgaW5uZXJfam9pbihwbGFuZXMsIGJ5ID0gInRhaWxudW0iKSAlPiUgCiAgZ3JvdXBfYnkoZW5naW5lKSAlPiUgCiAgc3VtbWFyaXNlKG5fZmxpZ2h0cyA9IG4oKSkKYGBgCgotLS0gCgoyLiAKCmBgYHtyIHpuMDctc29sbjIsIGNsYXNzLnNvdXJjZSA9ICJmb2xkLWhpZGUifQpjYXJyaWVyX2Rlc3QgPC0gZGF0YS5mcmFtZShjYXJyaWVyID0gYygiQUEiLCAiREwiKSwgZGVzdCA9IGMoIklBSCIsICJBVEwiKSkKCmZsaWdodHNfb2ZfaW50ZXJlc3QgPC0gaW5uZXJfam9pbihmbGlnaHRzLCBjYXJyaWVyX2Rlc3QsIGJ5ID0gYygiY2FycmllciIsImRlc3QiKSkKCmxhdGUgPC0gZmxpZ2h0c19vZl9pbnRlcmVzdCAlPiUgZmlsdGVyKGFycl9kZWxheSA+IDApCmVhcmx5IDwtIGZsaWdodHNfb2ZfaW50ZXJlc3QgJT4lIGZpbHRlcihhcnJfZGVsYXkgPCAwKQoKbnJvdyhsYXRlKQpucm93KGVhcmx5KQpgYGAKCi0tLQoKCjMuCgpgYGB7ciB6bjA3LXNvbG4zLCBjbGFzcy5zb3VyY2UgPSAiZm9sZC1oaWRlIn0KZ2dwbG90KGVhcmx5LCBhZXMoeCA9IGNhcnJpZXIsIHkgPSBhcnJfZGVsYXkpKSArIGdlb21fYm94cGxvdCgpCmdncGxvdChsYXRlLCBhZXMoeCA9IGNhcnJpZXIsIHkgPSBhcnJfZGVsYXkpKSArIGdlb21fYm94cGxvdCgpCgplYXJseSA8LSBlYXJseSAlPiUgbXV0YXRlKHN0YXR1cyA9ICJlYXJseSIpCmxhdGUgPC0gbGF0ZSAlPiUgbXV0YXRlKHN0YXR1cyA9ICJsYXRlIikKCnJiaW5kKGVhcmx5LGxhdGUpICU+JSAKICBnZ3Bsb3QoYWVzKHggPSBzdGF0dXMsIHkgPSBhaXJfdGltZSkpICsgCiAgZ2VvbV9ib3hwbG90KCkgKwogIGZhY2V0X3dyYXAodmFycyhtb250aCksIG5yb3cgPSAyLCBuY29sID0gNiwpCgpgYGA=